Shandong Fengtu IOT Technology Co., Ltd
Sales Manager:Ms. Emily Wang
Cel,Whatsapp,Wechat:+86 15898932201
Email:info@fengtutec.com
Add:No. 155 Optoelectronic Industry Accelerator, Gaoxin District, Weifang, Shandong, China


Sales Manager:Ms. Emily Wang
Cel,Whatsapp,Wechat:+86 15898932201
Email:info@fengtutec.com
Add:No. 155 Optoelectronic Industry Accelerator, Gaoxin District, Weifang, Shandong, China
Model:FT-WQX2A2
Brand:fengtu
1.2D Ultrasonic Anemometer Product Introduction
2D Ultrasonic Anemometer adopts ultrasonic technology and the principle of time difference method to measure wind speed and direction.FT-WQX2A2 ultrasonic wind speed and direction sensor uses ultrasonic time difference method to measure wind speed and direction.It has high measurement accuracy, reliable performance, easy to carry, no moving parts, uses an integral stainless steel shell, has IP66 protection level, and a very stable structure.(Optional) high-power self-heating module can work normally even in extreme cold and freezing weather at high altitudes.It is a relatively advanced instrument for measuring wind speed and direction.
2.Application fields of 2D Ultrasonic Anemometer
It is widely used in urban environmental monitoring, civil market, wind power generation, meteorological monitoring, ship navigation and drilling operation platform, high-speed railway and highway network, aviation and airport environmental monitoring, subway, tunnel and mining.
3.2D Ultrasonic Anemometer Product Features
1.Stainless steel integrated appearance design, exquisite appearance, using self-developed sensor technology for real-time measurement, no startup wind speed limit, no angle limit, and simultaneously obtain wind speed and wind direction data.
2.Multiple ultrasonic probes send and receive ultrasonic signals in real time within the measurement space to ensure that parameters are real-time and efficient.
3.High measurement accuracy, wide measuring range, good stability, low power consumption, strong anti-external interference ability, can work continuously, not affected by weather changes, and no calibration required.
4.Precision craftsmanship, all-solid-state design, more solid structure, high strength, weather resistance, corrosion resistance and waterproofness, long service life.
5.Professional integrated installation method, compact size, easy to carry and install.
6.An internal heating device can be installed according to the use environment (another optional item), and the maximum heating power can reach 120W
4.2D Ultrasonic Anemometer Technical Specifications
| Wind speed | Measuring range | 0~70 m/s |
| Start wind speed | 0.1m/s | |
| Response time | 1s | |
| Resolution | 0.1m/s | |
| Accuracy | ±0.3m/s or ±3% (0-30m/s, whichever is greater) ±5% (30-70m/s) | |
| wind direction | Measuring range | 0-360° |
| Start wind speed | 0.1m/s | |
| Accuracy | ±2° | |
| Resolution | 0.1° | |
| Heating option | Heating current | 0.6~1A |
| Power consumption | 15~25W | |
| Temperature control range | -30~60℃ | |
| Basic parameters | Digital signal | RS485 4-20mA |
| Baud rate | 9600, 19200, 38400, etc. | |
| voltage | 9~24VDC | |
| Average current | <35mA(12VDC) | |
| Operating temperature | -30~60°C | |
| Working humidity | 0~99%RH | |
| Protection level | IP66 |
The concepts of "precision agriculture" and "digital agriculture" advocated by modern agriculture are based on the in-depth understanding and application of soil information. Through the collection and analysis of soil data sets, decision support and early warning of soil moistur...
Online oil cleanliness tester employs the optical obscuration counting principle and a high-precision laser sensor to measure the size and quantity distribution of particles in oil in real time. The detection range covers 1–100 μm or 4–70 μm, and it incorporates ISO4406 and NAS1638 contami...
best weather station enables you to view temperature, humidity, barometric pressure, wind speed, wind direction, rainfall, etc., and is a fully functional weather station....
Traditionally, wind speed and direction measurements have relied on mechanical anemometers, but with the development of ultrasonic technology, people have begun to explore its application in wind speed measurements.The Ultrasonic Anemometer utilizes the properties of ultrasonic waves propagating thr...


 Get a Free Quote
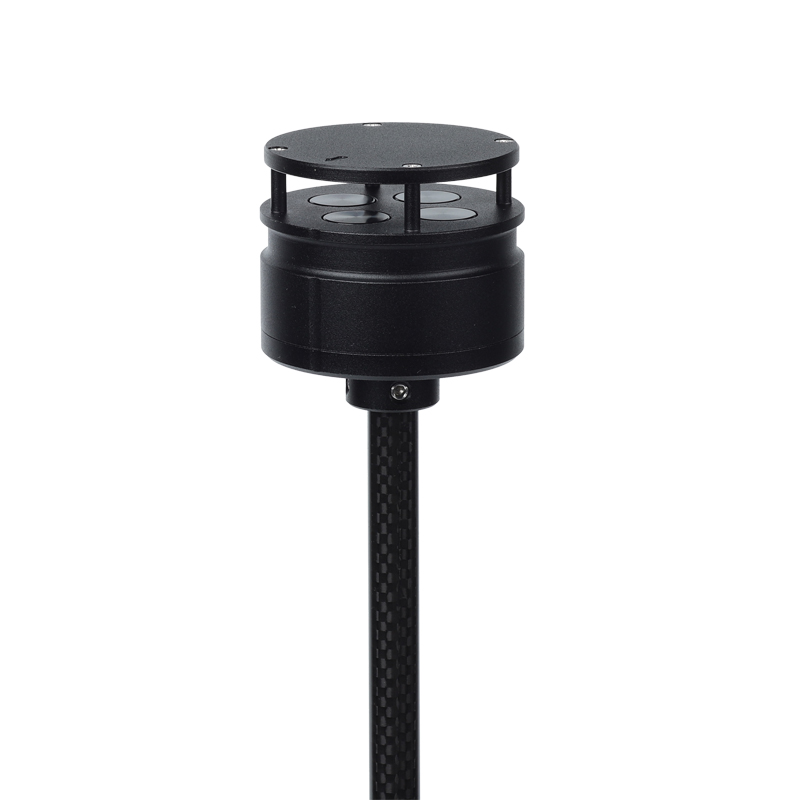
 Skype
Skype
 whatsapp
 mail
mail