Shandong Fengtu IOT Technology Co., Ltd
Sales Manager:Ms. Emily Wang
Cel,Whatsapp,Wechat:+86 15898932201
Email:info@fengtutec.com
Add:No. 155 Optoelectronic Industry Accelerator, Gaoxin District, Weifang, Shandong, China


Sales Manager:Ms. Emily Wang
Cel,Whatsapp,Wechat:+86 15898932201
Email:info@fengtutec.com
Add:No. 155 Optoelectronic Industry Accelerator, Gaoxin District, Weifang, Shandong, China
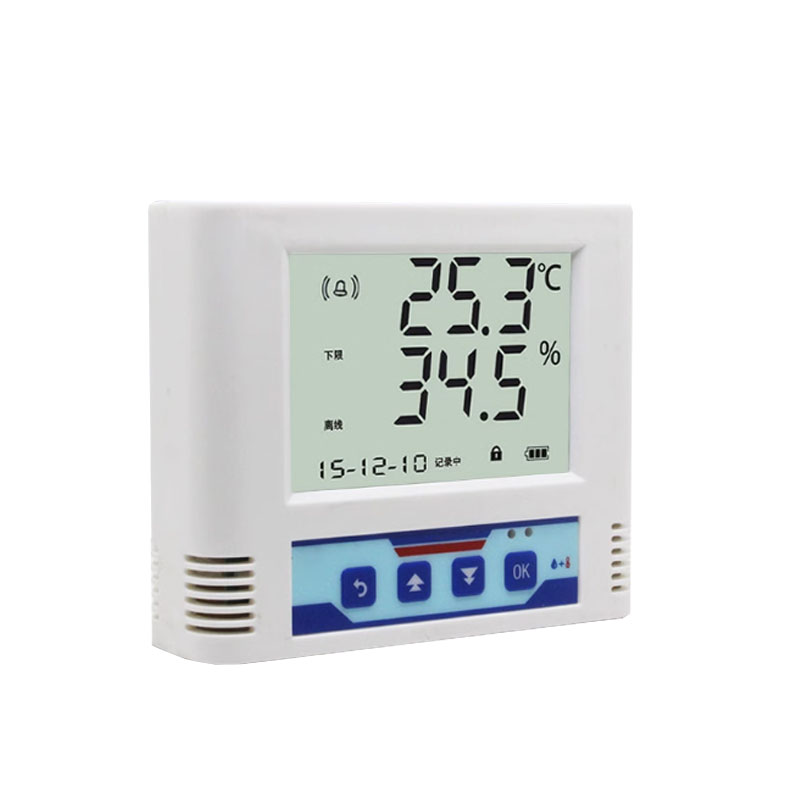
Model:FT-WSD2
Brand:fengtu
Indoor Temperature and Humidity Monitor Wall Mounted LCD Display
Indoor Temperature and Humidity Monitor is an instrument used to monitor temperature and humidity in real time. It can be used to measure indoor temperature and humidity.
Temperature and humidity detection principle: Use digital temperature and humidity sensors, encapsulate the thermal resistor and humidity-sensitive capacitor into a small chip, use full-range multi-segment calibration, and store the calibration data in the chip.
Temperature and humidity sensor: imported sht30
Product size: 122mm*102mm*36mm
LCD screen size: 76mm*53mm
Installation method: wall-mounted hoist hole installation (spacing 77mm, rotating hole diameter 5mm) or hanging buckle installation (spacing 170mm)
Two power supply options are available:
①, 10-30vdc wide voltage power supply, the power plug is suitable for both power plugs and can adapt to the output of 5.5mm*2.1mm*11mm or 5.5mm*2.5mm*11mmDC round hole plug.
②, 10-30vdc wide voltage power supply, terminal power supply
Temperature accuracy: ±0.5℃ (25℃)
Humidity accuracy: ±3%RH (5%RH~95%RH, 25℃)
Temperature range: -40℃~+120℃, humidity range: 0%RH~99%RH
Temperature display resolution: 0.1℃
Humidity display resolution: 0.1%RH
Temperature and humidity refresh time: 1S
Long-term stability: temperature ≤0.1℃/y, humidity ≤1%RH/y
Response time: Temperature ≤ 15s (1m/s wind speed), humidity ≤ 4s (1m/s wind speed)
Maximum power consumption: 0.4w
Wiring method: The terminal block adopts military-grade spring-type screw-free terminal, which can be connected by pressing and plugging. Even if there is no screwdriver on site, the wire can be quickly connected. It can adapt to wire diameters of 0.3 to 2.0 mm2
Self-calibration: temperature and humidity are checked and can be self-calibrated
RS485 configuration mode: You can modify the device communication parameters by pressing buttons, configuring tools, or 485 commands.
Relay load capacity (optional): 24V DC 1A, hysteresis control can be set, associated with temperature and humidity alarm upper and lower limits.
Screen display: real-time temperature and humidity value display, offline status prompt, temperature and humidity over-limit alarm prompt, RS485 address baud rate display, clock display. You can turn the page to view the upper and lower limits of temperature, upper and lower limits of humidity and other parameters.
Password protection: The device buttons are equipped with password protection function to prevent non-management personnel from tampering with parameters.
Body alarm mode: built-in buzzer alarm, alarm sound: ≥80dB, the buzzer alarm can be turned off at any time by pressing the button
With the urgent demand for meteorological information from all walks of life, small portable automatic weather stations with stable performance and accurate operation have become popular instruments and equipment in the market. Automatic weather stations can work normally in a variety of natural env...
The River Level Monitoring Station, as a key product of the Intelligent River Monitoring Project, plays an extremely important role in the field of hydrological monitoring.The flow velocity monitoring makes use of the Doppler effect of radar waves. When radar waves are emitted to the water flow, the...
Soil erosion refers to the process in which soil minerals, organic matter, and substances dissolved in water are dispersed, transported, and deposited under the action of water, wind, gravity, and human factors. Its hazards are multifaceted. On the one hand, it leads to a decline in soil fertility,...
The IV curve is a crucial indicator of photovoltaic (PV) string performance. By measuring the current through the string at different voltages, a relationship curve between current and voltage—i.e., the IV curve—is plotted. Analyzing the IV curve can reveal various issues in the PV string, such as...


 Get a Free Quote

 Skype
 whatsapp
 mail