Shandong Fengtu IOT Technology Co., Ltd
Sales Manager:Ms. Emily Wang
Cel,Whatsapp,Wechat:+86 15898932201
Email:info@fengtutec.com
Add:No. 155 Optoelectronic Industry Accelerator, Gaoxin District, Weifang, Shandong, China


Sales Manager:Ms. Emily Wang
Cel,Whatsapp,Wechat:+86 15898932201
Email:info@fengtutec.com
Add:No. 155 Optoelectronic Industry Accelerator, Gaoxin District, Weifang, Shandong, China
time:2025-04-07 09:47:45 source:Weather Station viewed:864 time
On the technical specification sheet of each photovoltaic (PV) module, an "IV curve diagram" is attached. What exactly is this? In fact, it is a current-voltage curve diagram, which is a characteristic curve used to describe the relationship between the output current and output voltage of a PV module under different lighting conditions and loads.
The IV curve diagram usually appears as a curve starting from the origin. The horizontal axis represents the voltage (V), and the vertical axis represents the current (I). As the voltage increases, the current remains relatively stable first and then drops sharply. This shape is derived from the superposition effect of the diode characteristics of the photovoltaic cells and the photo-generated current.
It shows the relationship between the current and voltage of the PV module under different operating conditions and is an important basis for evaluating the performance of the module.
There are several key parameters included in the IV curve diagram:
Short-circuit current (Isc), which is the current value when the output terminal of the module is short-circuited, corresponding to a voltage of zero.
Open-circuit voltage (Voc), which is the voltage value when the load resistance of the module is infinite, corresponding to a current of zero.
Maximum power point (MPP), which is the operating point where the module has the maximum output power, usually located at the "knee" position of the curve.
The power generation efficiency and performance of the PV module can be evaluated through the IV curve to check if they meet the standards. When there is a deviation between the actually measured IV curve and the standard curve, it may indicate that there are performance problems with the module, such as shadow obstruction, damage to the solar cells, or failure of the bypass diodes.
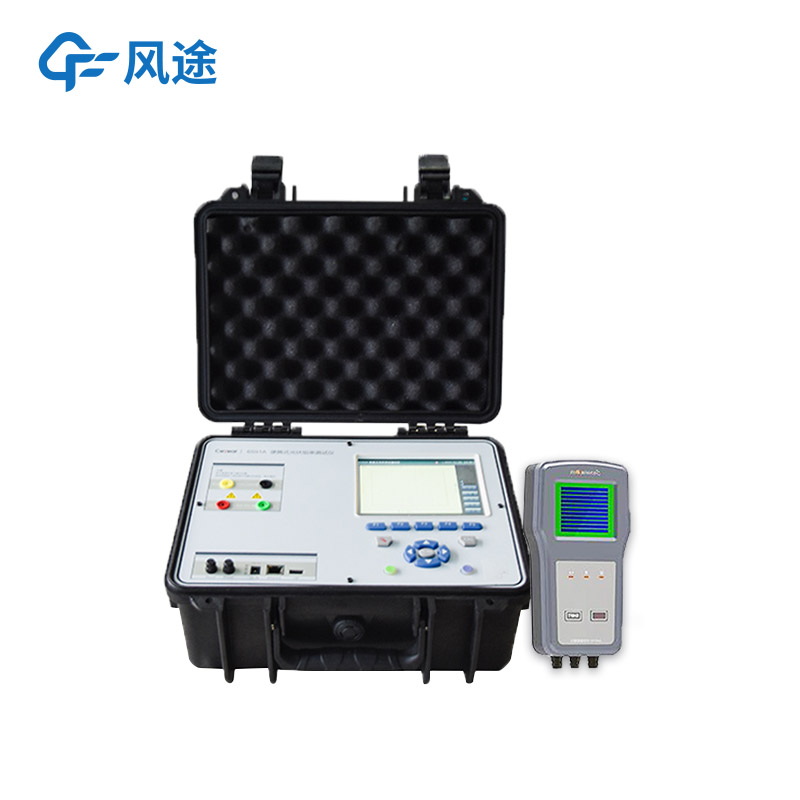
The I-V Curve Tracer draws the IV curve by applying different voltage values to the PV module and measuring the corresponding current output. This curve can intuitively show the current response characteristics of the PV module at different voltages, providing an important basis for performance evaluation, quality control, and fault diagnosis. When the tester is in operation, it is necessary to apply a continuous variable to the PV module and respond quickly to obtain an accurate IV curve diagram. Multiple measurements also need to be carried out to eliminate errors, and the test results should be compared with the standard curve to ensure the accuracy of the test results.
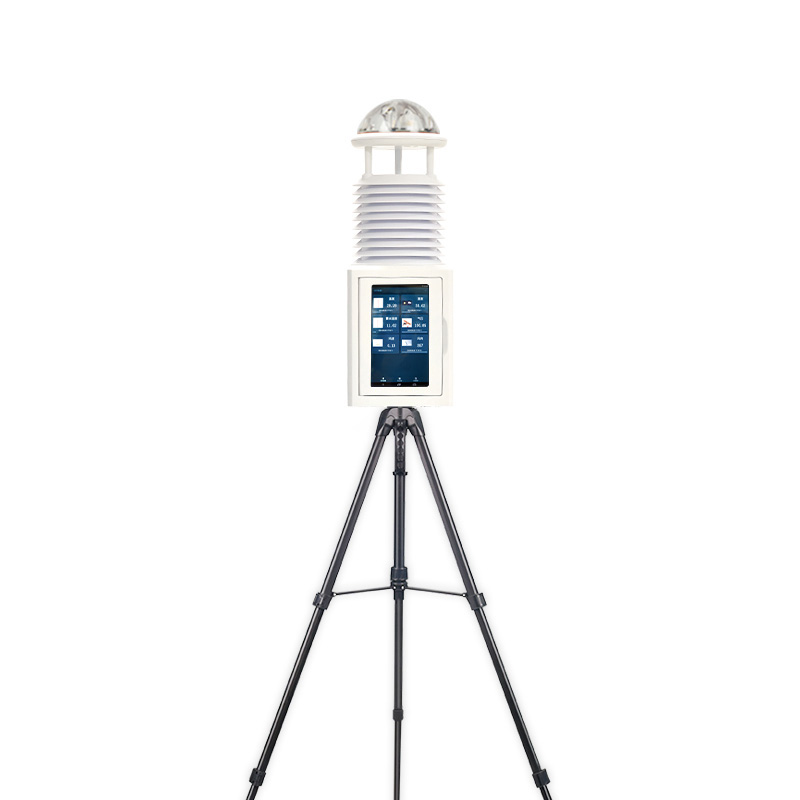
what are weather elements Including humidity, temperature, wind speed, rainfall, visibility, clouds, sunshine time and other meteorological parameters....
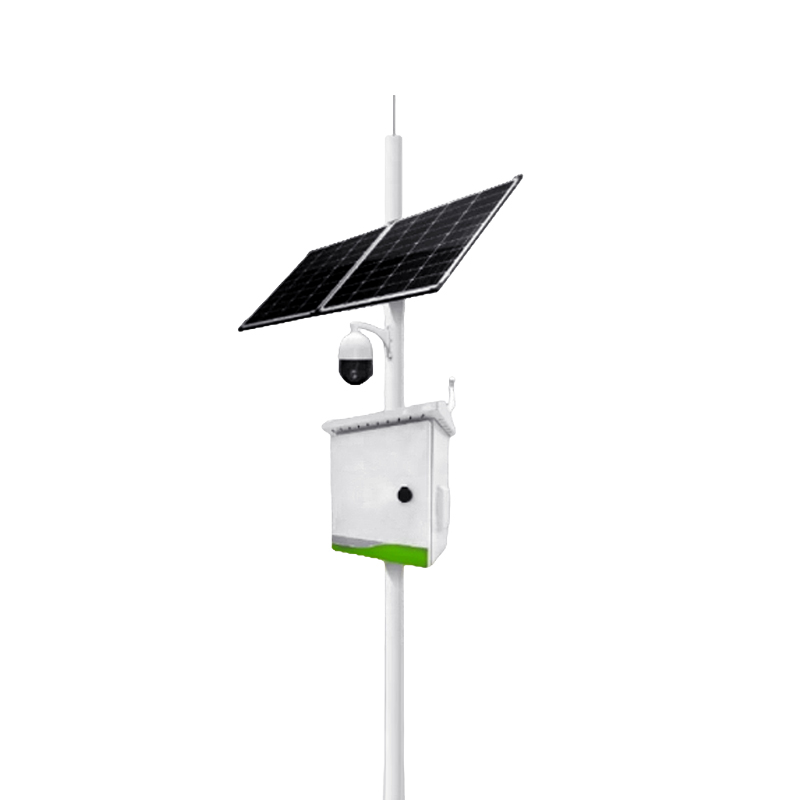
environmental parameters of sensors are used to monitor the atmospheric environment, which can detect temperature, humidity, pressure, light, rainfall, wind speed, wind direction, noise, PM2.5 and other environmental parameters....
Wireless level monitoring in wastewater treatment plants, is radar level meter feasible?To treat wastewater, it needs to go through a variety of processes, and this will involve the measurement of liquid level, flow, pressure, temperature, ph, dissolved oxygen, turbidity and other parameters, among...
soil sensors are used to monitor soil moisture conditions. They provide information on soil moisture, salinity, temperature, etc. They are suitable for horticulture, agriculture, indoor and outdoor plants....


 Skype
Skype
 whatsapp
 mail
mail