Shandong Fengtu IOT Technology Co., Ltd
Sales Manager:Ms. Emily Wang
Cel,Whatsapp,Wechat:+86 15898932201
Email:info@fengtutec.com
Add:No. 155 Optoelectronic Industry Accelerator, Gaoxin District, Weifang, Shandong, China


Sales Manager:Ms. Emily Wang
Cel,Whatsapp,Wechat:+86 15898932201
Email:info@fengtutec.com
Add:No. 155 Optoelectronic Industry Accelerator, Gaoxin District, Weifang, Shandong, China
time:2025-07-30 09:20:55 source:Weather Station viewed:739 time
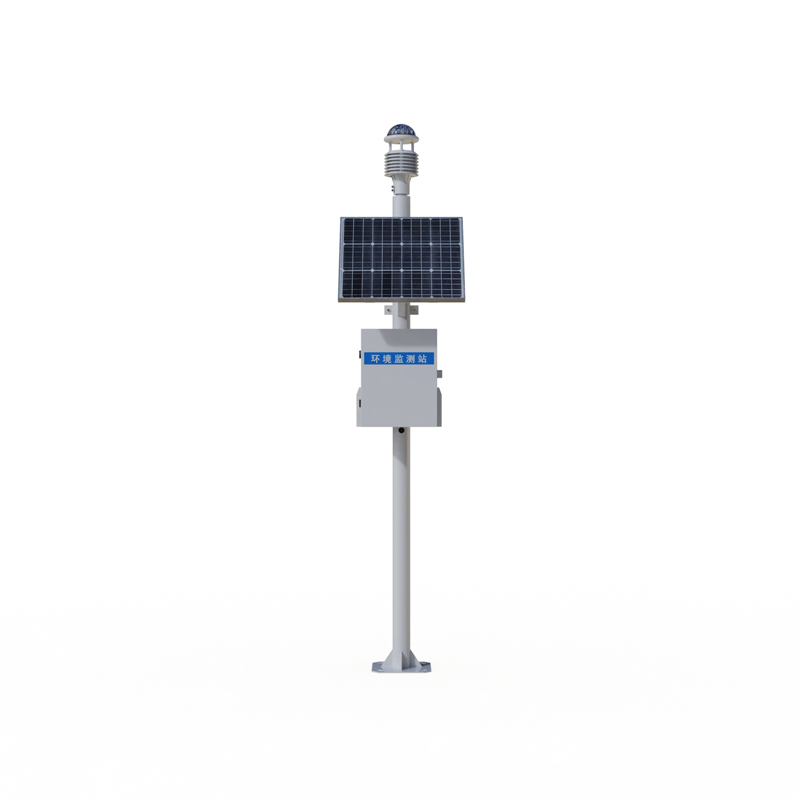
In the journey of air pollution control, accurately monitoring air quality and quickly identifying pollution sources are crucial steps toward success. This requires the use of an Air Quality Monitoring Station.
Traditional air quality monitoring mainly relies on a small number of large-scale monitoring stations. Although they can provide air quality data within a certain area, they are insufficient when facing complex and ever-changing urban environments. Large monitoring stations are sparsely distributed, making it difficult to fully cover every corner of the city, resulting in failure to timely capture pollution conditions in many local areas. Moreover, their monitoring range is relatively large, making it hard to accurately locate and analyze small pollution sources or pollution characteristics in specific regions.
The Air Quality Monitoring Station breaks the limitations of traditional monitoring. It adopts an innovative grid-based layout method, dividing the monitoring area into numerous small grids and installing monitoring equipment in each grid, thus achieving comprehensive and all-round monitoring of the atmospheric environment. These monitoring devices keep a close eye on air quality changes within their respective grids at all times.
The Air Quality Monitoring Station can monitor a variety of air pollutants in real time and accurately, such as sulfur dioxide, nitrogen dioxide, carbon monoxide, ozone, and particulate matter (PM2.5, PM10). It has ultra-high temporal and spatial resolution, enabling real-time data updates to accurately reflect air pollution conditions in different regions and at different times. Through it, we can clearly observe the significant increase in PM2.5 concentration near urban main roads during morning and evening rush hours, as well as the spread of the pollution range along the direction of traffic flow. This allows relevant departments to promptly grasp pollution dynamics and quickly take response measures. Furthermore, the cost of this detection equipment is relatively low, facilitating large-scale deployment. It can be widely installed in urban streets, on lamp posts, and on building rooftops, forming a dense monitoring network. In addition, it is small in size and easy to install, occupying little space and not damaging the urban landscape.
In urban environmental monitoring, it helps environmental protection departments quickly identify pollution hotspots and track pollution diffusion paths. With the grid-based monitoring system, key areas are monitored 24 hours a day. Once pollution exceeds the standard, source tracing investigations are immediately carried out, and targeted control measures are taken to improve regional air quality.
In industrial parks, it monitors enterprise emissions at all times, urging enterprises to strictly fulfill their environmental protection responsibilities.

Based on electrochemical impedance spectroscopy (EIS), Oil conductivity sensor measures the resistivity changes of fire-resistant oils and lubricating oils online. This sensor reflects additive loss, aging, and contamination status through impedance spectroscopy analysis. It is suitable for th...
Water Level Monitoring Station is a technological facility that uses low-power intelligent sensing devices as its core to continuously monitor the water levels of rivers and lakes,This system provides decision support for flood control, disaster reduction, and water resource management by accurately collecting hydrological data....
The IV curve is a crucial indicator of photovoltaic (PV) string performance. By measuring the current through the string at different voltages, a relationship curve between current and voltage—i.e., the IV curve—is plotted. Analyzing the IV curve can reveal various issues in the PV string, such as...
Utilizing LoRa wireless transparent transmission technology, the 400-Meter LoRa Transparent Transmission Anemometer for Drones drone-mounted anemometer/wind vane offers an effective coverage radius of up to 400 meters. Through its transparent transmission modules, it achieves zero-latency data...


 Skype
 whatsapp
 mail